Erf 946 Ambrose Street, Kleine Kuppe, Windhoek · Hallie Investments No. 3162 (Pty) Ltd · Old Mutual Alternative Investments · 41,532 m²
N$98.5M
Market Value
N$540,912
Monthly Income
92.5%
Occupancy
53 / 154
Units Built
N$73.9M
Force Sale Floor
12.3%
Bad Debt Rate
Wilhelm Wittmann · Old Mutual
WWittmann@oldmutual.com
Petrus Amadhila · +264 81 956 1135
Managed: Safland International Property Services
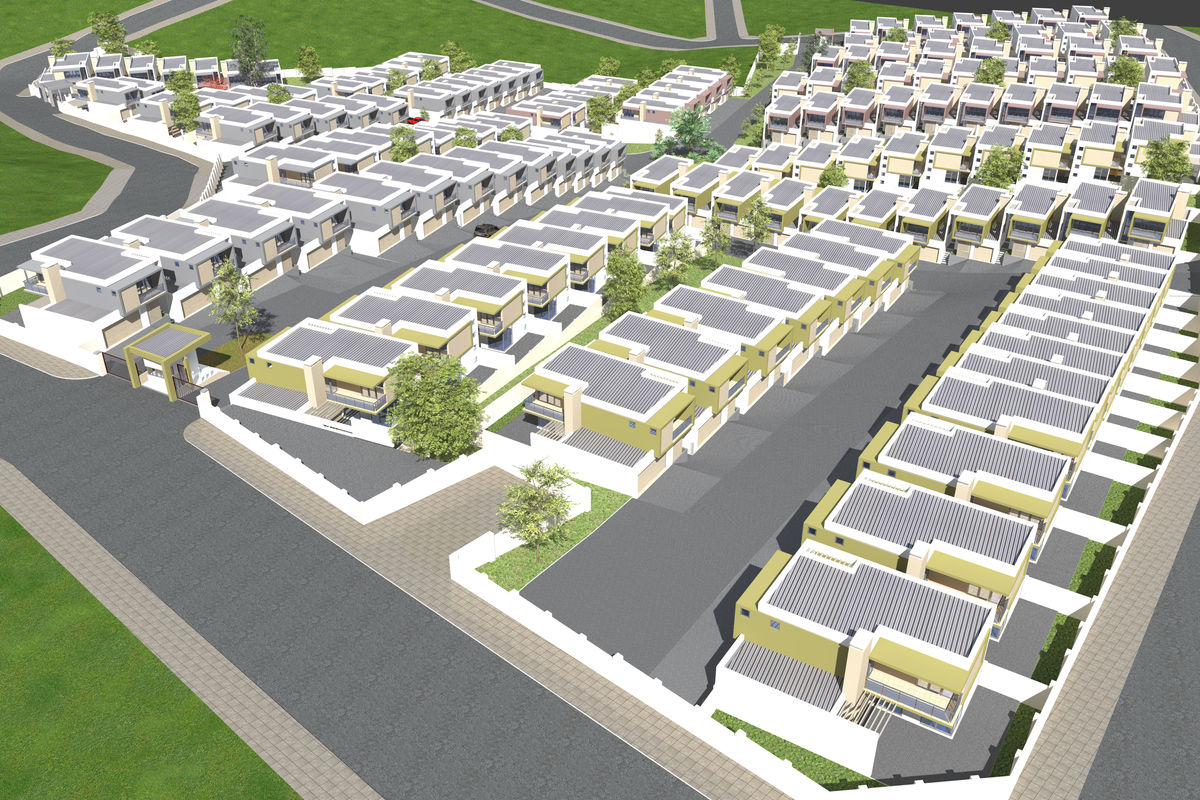
GALLERYAmbrose Village · Marley Tjitjo Architects · MT Arch Inc.
1 / 17
Click to expand · use ← → keys to navigate
⏳
WALE risk: ~80% of leases expire in a single 12-month window (Apr 2027 – Mar 2028). A buyer acquiring this asset today owns a 1.5-year lease book, not a stabilised income stream. Re-letting risk is significant and needs to be priced in.
⚠️
Development economics are negative. The valuation confirms replacement cost of N$2.34M (2-bed) and N$3.04M (3-bed) per unit — both exceed current market values of N$1.8M and N$2.2M. Building Phase 2/3 at current construction costs destroys value. Do not underwrite completion of 101 units without a meaningful price uplift or cost reduction.
Bad debts: N$796,688 written off in the year to April 2026 — approximately 12.3% of gross annual income. Several tenants on eviction proceedings. This is a materially higher bad debt rate than a stabilised income property. Arrears currently N$148,057.
🛢️
Venus FID is not priced in. The December 2025 valuation explicitly cited Shell's non-commercial discovery as a negative and the oil opportunity as delayed. TotalEnergies Venus FID (which you track for the Namibia B&B thesis) would be a material upside catalyst for Windhoek residential demand — not reflected in the N$98.5M valuation.
Valuation — Property Valuations Namibia · 31 December 2025
Market Value
N$98.5M
NPV discounted sell-out (16%, 18–24 months)
Gross project value: N$126.7M · Less 16% discount + 2% agent commission · Income approach NOT used
Force Sale Value
N$73.9M
Old Mutual's floor — 25% discount to market
This is the practical floor for any offer. OM will not go below this. Indicative entry range: N$80–88M.
Insurance / Replacement Value
N$143.0M
incl. 15% VAT + rent loss
2-bed replacement: N$2.34M · 3-bed replacement: N$3.04M. Both exceed market value — development economics are negative at current build cost.
Asking prices are 14–24% above the Dec 2025 valuation — sellers are pricing N$2.05–2.24M. Valuation may be conservative, or FNB’s +7.1% Q1 2026 price growth has passed through. Build cost N$2.34M still exceeds even current asking prices.
3-bed asking prices at N$2.0–2.1M are slightly below the Dec 2025 valuation of N$2.2M. Build cost N$3.04M is still 45–52% above market. Kalahari Deals listing notes levies of N$3,600/mo — relevant for buyer running costs.
Incomplete Units (27)
N$15.1M
Outstanding contractor balance to finish 27 partially-built units — source: Trial Balance
6 units — at slab level
N$710K each
OM priority tranche · positive economics
21 units — at foundation level
N$515–570K each
Longer lead time
Two different methodologies — not comparable
Figure
Source
Basis
N$710K to complete
Trial Balance
Actual outstanding amount on existing builder contract — priced when contract was signed, not today’s rates
The 6 slab units have clear positive economics: N$710K in (contracted price, real number) vs N$1.8–2.24M market value out. Complete them.
Phase 2/3 diligence required: The N$2.34M build cost for the 101 raw land units is a desktop estimate only. Before ruling out development, a QS should price it from plans. Actual contractor quotes — with site established, planning approved, and no mobilisation costs — could come in 15–25% below the valuer’s desktop number.
Undeveloped Land — Buildout Potential
N$28.3M
~25,300 m² at N$1,120/m²
101
Permitted units (masterplan)
166
Max units at 1:250 density
N$280K
Land cost per buildable unit
Phase
Units
Status
Est. build cost
Ph 2 — 6 slab
6
Start now
N$4.26M
Ph 2 — 21 foundation
21
Medium term
~N$11.3M
Ph 2 — 27 unstarted
27
Needs Venus FID
~N$71M †
Ph 3 — raw land
47
Needs Venus FID
~N$124M †
† Greenfield desktop estimate only — exceeds current market values. Viable only post-Venus FID price uplift or confirmed QS quotes 20%+ below valuer’s N$11,200/m² rate. Zoning: General Residential · Density: 1:250 · confirmed by Wilhelm Wittmann, Old Mutual.
Income Performance — Rent Roll as at April 2026
Gross Monthly Income
N$540,912
Confirmed — Safland rent roll · Annualised: N$6.49M
2-Bedroom units (124m²)
N$273,715
21 tenanted · 1 vacant
Avg N$13,034/unit
Range N$11,550–N$14,000
3-Bedroom units (160m²)
N$240,348
16 tenanted · 2 vacant
Avg N$15,022/unit
Range N$13,781–N$16,207
Occupancy
92.46%
34
Units tenanted
3
Vacant
37
Total in portfolio
Vacant units: 25, 51, 52 · Normal frictional vacancy · 1 unit recently terminated (Norbert Dorgeloh, Unit 12)
Bad Debts (Year to Apr 2026)
N$796,688
12.3% of gross annual income written off
Large write-off incl. Franscisca Mokanya (N$64,966) + prior tenants. This is a recurring issue.
⚠️ Operating costs (management fees, maintenance, levies, insurance) not yet deducted — true net yield will be lower. Trial balance needed for full picture.
SPV Financial Position (Trial Balance — April 2026)
Item
Amount
Property bank account
N$7,969,339
Debtors (accounts receivable)
N$537,484 (net)
Deposits held (tenant security)
N$582,328
VAT liability
–N$287,384
Retained income (accumulated)
N$7,312,329
Bad debts (year)
–N$796,688
The SPV is cash-rich (N$7.97M in bank). This is likely distributable to OM — do not assume it transfers with the asset in a property purchase. Confirm structure with OM on deal.
Lease Expiry & WALE Risk
Lease Expiry Profile (by number of units)
3 units
Vacant
~5 units
Expiring Apr 2026–Mar 2027
~27 units
Expiring Apr 2027–Mar 2028
~2 units
Post Apr 2030
V
~1yr
~2yr — 79.8% ROLLS HERE
4yr+
Band
Units
Monthly Rent
% of Income
Expiring Apr 2026–Mar 2027
~5 units
N$81,407
15.1%
Expiring Apr 2027–Mar 2028
~27 units
N$431,505
79.8%
Expiring post Apr 2030
~2 units
N$28,000
5.2%
Estimated WALE: ~1.5 years. This is a short book. Acquiring at market value (N$98.5M) means you're buying a property where 80% of income renegotiates in FY2028. Price in a lease renewal incentive budget.
Arrears — Problem Tenants (as at April 2026)
Tenant
Unit
Outstanding
Status
Morais Paulo Bianga
42
N$41,054
Eviction
CGI Namibia Trust
46
N$26,816
Negotiating
Andreas Floris Schlechter
11
N$25,381
Eviction
Sikota Mutanekelwa Zeko
48
N$25,311
Arrangement
LJC Church of Latter-day
36
N$25,944
Lease expired
Nicla Augstinho Dos Santos
53
N$19,299
Arrangement
Mariet Diergaardt
15
N$14,538
March o/s
Light Steel Frame Constr.
51
N$13,736
Vacant · ITC
TOTAL ARREARS
N$148,057
Also note: Unit 25 (Franscisca Mokanya) had N$64,966 written off as bad debt in April 2026. Prior tenants across multiple units carry residual balances of N$20K–N$23K each. Pattern of serial bad debt suggests tenant screening process needs improvement.
Gross Rent per Unit — by Lease Start Date (all 37 active leases)
Each dot = one lease. X-axis = when lease was signed. Y-axis = actual monthly rent in N$. Are landlords achieving higher rents on more recent leases? Use to forecast renewal income at the FY2028 WALE cliff.
2-bed renewal target: ~N$14,500/mo 3-bed renewal target: ~N$16,500/mo Portfolio income +5–10% if renewals hold
Reading the data: 3-bed rents show a clear upward channel from N$14,000/mo (Sep 2023) to N$16,000/mo (Apr 2026) — ~5.5% annualised growth. 2-bed rents are noisier (N$11,550–N$14,000/mo) but the newest leases cluster at N$13,600–N$14,000/mo, suggesting the floor is rising.
The FY2028 WALE cliff is therefore a risk and an opportunity: 27 leases reset at once. If you can renew at trend rates you pick up ~5–10% income growth in a single year. If 5–10 tenants don’t renew, you face a vacancy problem in a market where 3 units are already sitting empty.
Recommended escalation clause on any new leases: 7–8% p.a. — ahead of current market trend, to protect against construction cost inflation and maintain yield.
Unit Status Tracker
Ambrose Village — 154 Units Total (Masterplan)
12 sold
4 u/o
~37 letting
3 vac
6 partial
· · · 81 unbuilt · · ·
🟢 12 sold & transferred🟩 4 under offer🔵 ~37 tenanted (Hallie)⬜ 3 vacant🔲 6 partially built (priority)⬛ 81 unbuilt
42
Completed at Dec 2025 valuation
53
Completed per OM (June 2026)
27
Incomplete at valuation
41,532 m²
Total erf
⚠️ Discrepancy: Valuation (Nov 2025) shows 42 completed. Wilhelm's email (Jun 2026) says 53. 11 units completed in the interim — probably includes some of the 6 priority units. The December valuation was done on 42 complete units; today's value is higher.
Build Status — What's Constructed vs What Isn't
154-Unit Masterplan — Phase Build Status
Units 1–53Units 54–107Units 108–154
✓ Phase 1
53 units BUILT
slab
21 at fdn.
27 Phase 2
unstarted
Phase 3 — 47 units
undeveloped land
53 units built (Phase 1) 6 at slab — 24% complete 21 at foundation — 8% complete 27 Phase 2 unstarted 47 Phase 3 undeveloped
OM's stated near-term priority: complete the 6 slab-level units. Zones labelled "FUTURE EXPANSION" on site plan. Temporary steel sheeting boundary (not permanent wall).
⬛ Phase 3 — NOT STARTED
47 units
19 × Type-A (3-bed) + 28 × Type-B (2-bed)
Labelled on site plan as "FUTURE APPROVED APARTMENTS" — northwest and central-east zones. Pure undeveloped land within the 41,532 m² erf. No construction commenced.
Metric
Value
Land area (est.)
~25,300 m²
Land value
N$28.3M (at N$1,120/m²)
Max density
1:250 → ~101 more units possible
Development economics
Negative — build cost > market value
Cost to Complete — Phase 2 Priority Units (6 at Slab Level)
If 2-bed units (88 m²)
Item
Cost
Remaining build (76%)
N$757K
Market value at completion
N$1.80M
Incremental gain
N$1.04M
If 3-bed units (114 m²)
Item
Cost
Remaining build (76%)
N$991K
Market value at completion
N$2.20M
Incremental gain
N$1.21M
⚠️ But note: total build cost is negative
The 6 slab units are the ONLY ones worth completing — you're 24% in and incremental cost to finish is less than market value. The 21 foundation units and 27 unstarted Phase 2 are all negative economics at current build rates.
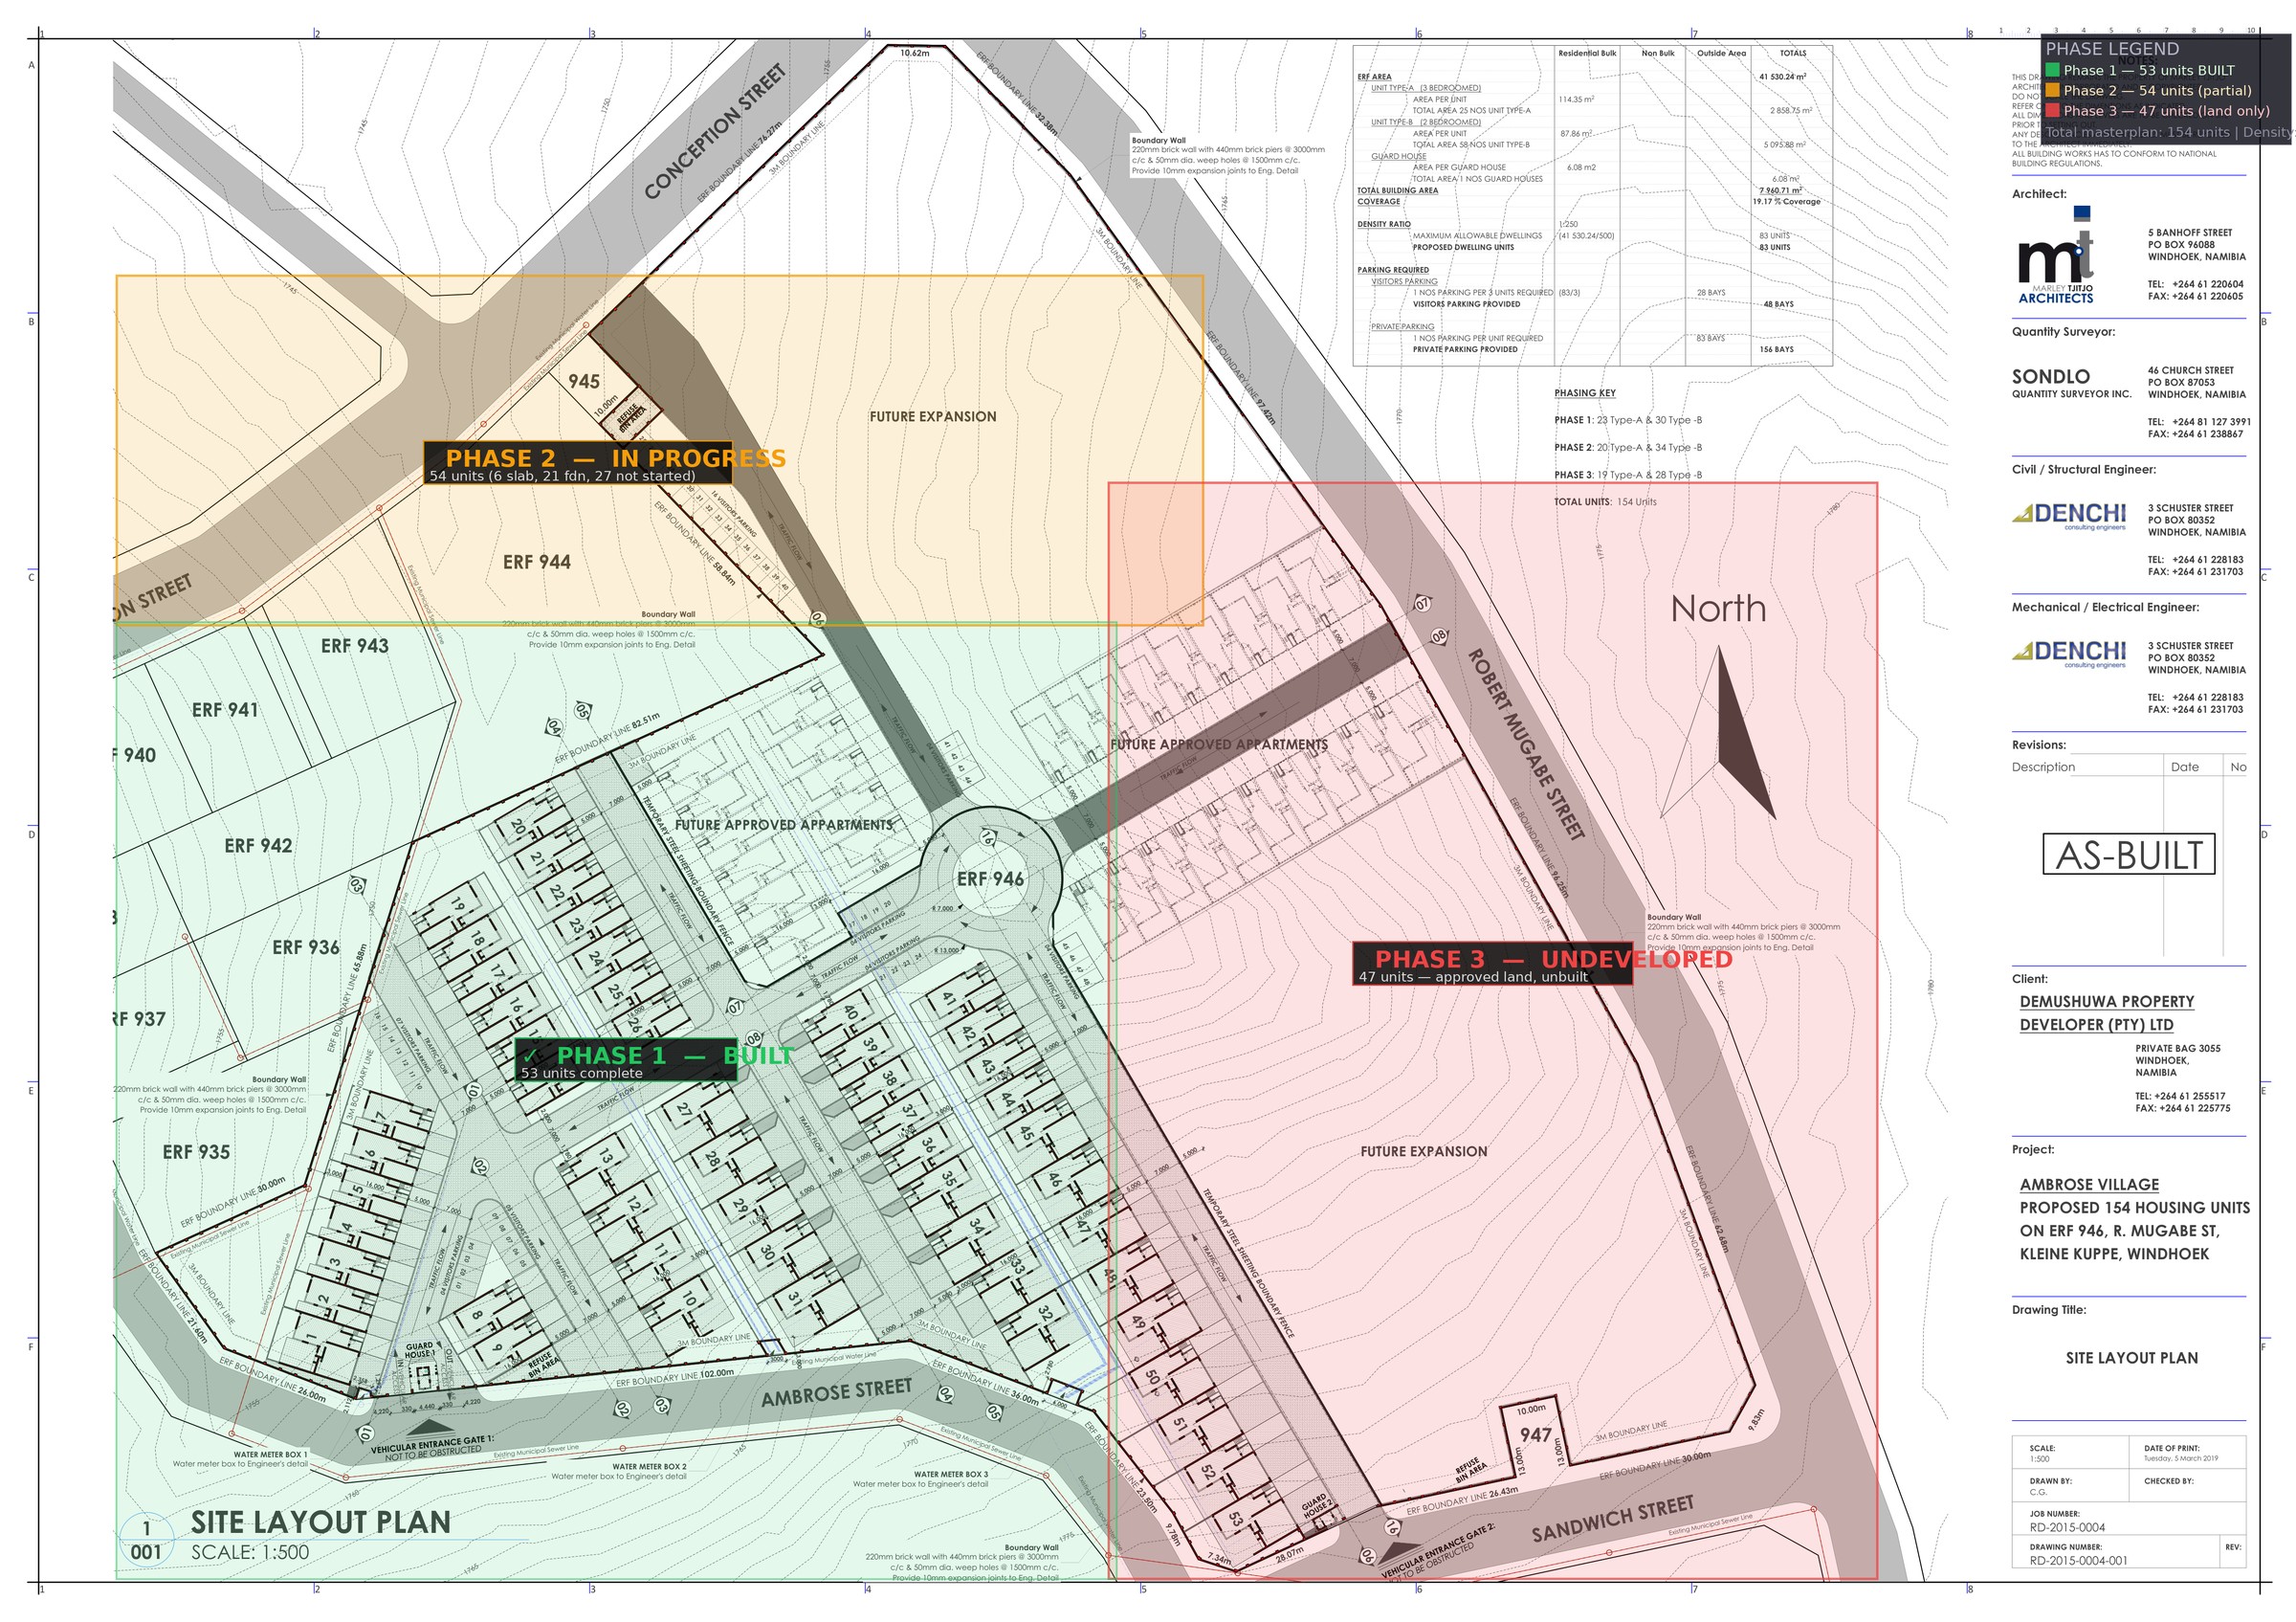
Site Layout Plan — Phase Zones (Erf 946, Scale 1:500, AS-BUILT 2019 + Phase 2/3 approved)
Click to expand
✓ Phase 1 — Central/SW zone 53 units complete · bounded by permanent 220mm brick wall · both gates (Ambrose St + Robert Mugabe Ave) serve Phase 1
⬡ Phase 2 — North zone (near Conception St) 54 units · 6 at slab, 21 at foundation, 27 unstarted · labeled "FUTURE EXPANSION" on original plan · now approved under 1:250 density
○ Phase 3 — East zone (along Robert Mugabe Ave) 47 units · labeled "FUTURE APPROVED APARTMENTS" · pure undeveloped land · temporary steel sheeting boundary
Site Plan — Key Facts (Drawing RD-2015-0004-001, AS-BUILT March 2019)
Field
Detail
Original developer
Demushuwa Property Developer (Pty) Ltd
Architect
Marley Tjitjo Architects Inc.
QS
Sondlo Quantity Surveyor Inc.
Civil/Structural/MEP
Denchi Consulting Engineers
Erf area (survey)
41,530.24 m²
Type-A unit (3-bed)
114.35 m² per unit
Type-B unit (2-bed)
87.86 m² per unit
Field
Detail
Access Gate 1
Ambrose Street (south)
Access Gate 2
Robert Mugabe Avenue (east)
Private parking
156 bays (1 per unit)
Visitor parking
48 bays (vs 28 required)
Boundary (Phase 1)
Permanent 220mm brick wall
Boundary (Phase 2/3)
Temporary steel sheeting
Phase 2/3 zones labelled
"Future Expansion" + "Future Approved Apartments"
Density — CONFIRMED by Wilhelm Wittmann (Old Mutual), 2 June 2026: Original approval was 1:500 = 83 units max → hence "Future Expansion" zones on the 2019 drawing. Density has since been re-approved at 1:250, allowing 154 units. Planning risk on Phase 2 & 3 is zero — the rezoning is done. The only obstacle to building is development economics (build cost > market value at current prices).
Development Economics
Can You Build Profitably? — Market Value vs. Replacement Cost
What each unit is worth on the market today vs. what it costs to build a new one from scratch. If build cost exceeds market value, developing new units destroys capital.
Unit Type
Market Value (what you’d sell for)
Build Cost (what it costs to construct)
Verdict
2-Bedroom (122 m²)
N$1,800,000
N$2,340,000
–N$540K loss per unit
3-Bedroom (160 m²)
N$2,200,000
N$3,035,000
–N$835K loss per unit
Phase 2/3 total (101 units)
~N$188M potential revenue
~N$251M to build
–N$63M total loss
Build rate: N$11,200–11,250/m² base + 15% professional fees + 10% escalation + 5% contingency + 15% VAT — desktop benchmark only, no builder quote obtained (source: Property Valuations Namibia, Dec 2025). A QS assessment on actual plans could be 15–25% lower.
Bottom line: do not build Phase 2/3 at current prices. The existing 53 Phase 1 units are valuable because they were built years ago at lower cost. The land bank has option value — exercise it only when Venus FID lifts market values or construction costs come down ~30%.
Development Potential — What Can Be Built (Confirmed 1:250 Density)
Old Mutual confirmed 1:250 density rezoning (up from 1:500). 41,532m² erf ÷ 250 = max 166 units on the full site. 53 already built = 113 permissible on undeveloped land. Masterplan uses 101 of these.
Phase 2 — North Zone (54 units)
6 units at slabN$4.26M to complete
21 units at foundation~N$11.3M to complete
27 units unstartedPermitted, plans approved
Phase 3 — East Zone (47 units)
47 units — all raw landPermitted at 1:250
~25,300m² undevelopedN$28.3M land value
N$280Kland cost per unit
Scenario
Units
Est. GDV
Build Cost*
P&L
Rental Income p.a.
6 slab units only Immediate action
6
N$12.5M
N$4.26M
+N$8.2M
N$1.01M 23.7% on capex
Phase 2 complete (54 units) Slab + foundation + unstarted
54
~N$112M
~N$143M
–N$31M
N$8.7M at current rents
Full buildout (101 units) Ph 2 + Ph 3, all raw land
101
~N$209M
~N$267M
–N$58M
N$16.9M total portfolio N$23.4M
Build cost exceeds GDV at current prices. Viable only for the 6 slab units (capex already partially sunk). Phase 2/3 flips to positive if: (a) market values rise ~25–30% (Venus FID catalyst), or (b) QS confirms actual build costs 15–20% below the valuer’s desktop N$11,200/m² estimate.
*Build cost = greenfield desktop estimate (Property Valuations Namibia, Dec 2025). No actual contractor quotes obtained. GDV based on current market asking prices. Land cost N$280K/unit already paid as part of site purchase.
Offer Pricing Framework
Indicative Offer Ranges
Two views: yield on total price vs. yield on the income-producing component only (total price minus N$28.3M undeveloped land that generates zero income).
Entry Price
Gross Yield on total price
Net Yield* on total price
Implied price for income asset (excl. N$28.3M land)
Gross Yield on income asset only
Net Yield* on income asset only
N$98.5M
6.6%
5.8%
N$70.2M
9.2%
8.1%
N$88.0M
7.4%
6.5%
N$59.7M
10.9%
9.5%
N$80.0M
8.1%
7.1%
N$51.7M
12.6%
11.0%
N$73.9M
8.8%
7.7%
N$45.6M
14.2%
12.5%
At N$80M: you are effectively paying N$51.7M for the income stream and N$28.3M for the land bank. The income stream alone yields 12.6% gross / 11.0% net on that implied price — a compelling number for an EM income investor. The land is an option on future development (Venus FID / construction cost normalisation), held at a reasonable N$280K/buildable unit.
*Net yield = after 12.3% bad debt adjustment only. Management (~8%), maintenance, and insurance not yet deducted — true net-of-all-costs yield is 3–4% lower. Opening offer: N$78–82M.
Yield Sensitivity — 5% Annual Rent Escalation
Yield on income-producing asset only (entry price minus N$28.3M undeveloped land). Assumes +5% p.a. rent escalation. Entry price fixed.
Entry Price
Income asset price – N$28.3M
Year 1
Year 2
Year 3
Year 5
Year 7
Gross yield on income asset
N$98.5M
N$70.2M
9.2%
9.7%
10.2%
11.2%
12.4%
N$88.0M
N$59.7M
10.9%
11.4%
12.0%
13.2%
14.6%
N$80.0M
N$51.7M
12.6%
13.2%
13.8%
15.3%
16.8%
N$73.9M
N$45.6M
14.2%
14.9%
15.7%
17.3%
19.1%
Net yield on income asset (after 12.3% bad debts)
N$98.5M
N$70.2M
8.1%
8.5%
8.9%
9.9%
10.9%
N$88.0M
N$59.7M
9.5%
10.0%
10.5%
11.6%
12.8%
N$80.0M
N$51.7M
11.0%
11.6%
12.1%
13.4%
14.8%
N$73.9M
N$45.6M
12.5%
13.1%
13.8%
15.2%
16.7%
Escalation assumption: 5% p.a. consistent with trend data (3-beds +5.5% p.a. since 2023, data from tenancy schedule). Does not account for vacancy between tenancies or letting incentives at WALE cliff. Operating costs not deducted.
Negotiation Leverage Points
Short WALE — 80% of leases roll within 18 months. Significant re-letting risk. Justify a 15–20% discount to market value.
Bad debt history — 12.3% write-offs are high. Demand escrow or price reduction for legacy arrears and open eviction proceedings.
Valuation methodology — Sell-out approach, not income cap. An income approach at 8–9% cap rate gives N$72–80M. Push back on the N$98.5M.
Incomplete units & site issues — 6 partially built units cost money to complete. Stormwater remediation ongoing. Use as negotiating points.
Stable/sideways market — Valuers rated it 3/5, capital growth 2/5. Market has been flat for 84 months. No urgency for KDD to pay full price.
Strategic Scenarios
📦 Option A — Income-only acquisition
Buy the existing 53-unit income stream. Stabilise the rent roll, address evictions, renew leases. Hold the undeveloped land passively. Underwrite at N$80M.
Pros: Immediate income, low execution risk, land optionality preserved
Cons: Short WALE, bad debt legacy, no near-term development upside
🏗️ Option B — Income + selective Phase 2 completion
Buy the asset, complete the 6 priority units (low cost — slab already done), then wait for Venus FID demand signal before committing to Phase 2/3 (101 units).
Pros: Completes near-finished inventory at low incremental cost, preserves optionality
Cons: Still negative build economics — complete only if completing saves money vs abandoning
✏️ Option C — Redesign remaining land
Buy the asset. Hold Phase 1 income. Engage town planning to subdivide remaining 25,300 m² for alternative product: either premium (fewer larger units) or affordable (many smaller units, different economics).
Pros: Potentially unlocks better margin than completing original design
Petrus Amadhila · +264 81 956 1135 · Petrus.Amadhila@oldmutual.com
Windhoek Market Context
Indicator
Value
Source
FNB HPI growth (Q1 2026)
+7.1% YoY
FNB Namibia
Windhoek avg house price
N$1.82M
FNB Q1 2026
Mortgage credit growth
1.9%
FNB March 2026
Average Windhoek rent
N$7,611/mo
FNB Q1 2025
Kleine Kuppe 2-bed asking
N$1.3M–1.9M
Property24
Kleine Kuppe 3-bed asking
N$3.5M–5M+
Rightmove WB
Valuer's price trend
Sideways/stable (36 months)
Dec 2025 valuation
Growth outlook 2026/27
1–2% envisaged
Dec 2025 valuation
Venus FID catalyst: Not priced in. Valuers specifically cited non-commercial Shell discovery as negative. TotalEnergies Venus (your thesis) would change this picture — Windhoek demand, expat worker housing, contractor accommodation could all benefit.